Queue Specific Workflow Charts
If a Workflow has one or more Queue Nodes in it, two other charts will appear to illustrate the time range and status of the selected Queues.
Queue Durations Chart
The Queue Durations chart is color-coded to indicate processing times for Queues in the selected Workflows:
- Shortest –The green area represents the shortest processing time for the documents in the selected Workflows.
- Average – The statistical average processing time is represented by the yellow area.
- Longest – The orange area indicates longest processing time.
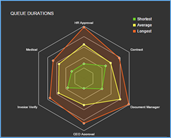
Queue Durations Chart
Queue Status Chart
The Queue Status chart illustrates the overall number of documents moving through the Queues of the selected Workflows. The graph shows documents entering and leaving a Queue, as well as documents that were already in a Queue during a time/date range, and of those, which ones remain.
Graph information is color-coded to indicate the status of the Workflow documents within and peripheral to the Workflow selected date range:
- Remaining Within - A document entered the Workflow before the selected date range and was still in the Workflow after the selected date range. (The document was actively being processed in the Workflow before, during, and after the selected date range.)
- New Within - A document entered the Workflow at some point within selected date range and was still in the Workflow after the selected date range. (A new document which has entered the Workflow was actively being processed in the Workflow during and after the selected date range.)
- Remaining Left - A document entered the Workflow before the selected date range but has exited the Workflow at some point during the date range. (The document was actively being processed in the Workflow before and during some part of the selected date range.)
- New Left - A document entered and then exited the Workflow at some point within selected date range. (A new document began and finished processing during some part of the date range.)
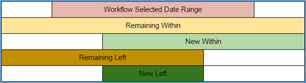
Workflow Chart Status Key
Hover over the chart segments to view the exact number of documents. If no data is found for the select date range, the “No Workflow Data Found” message will appear.
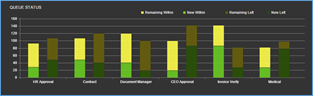
Queue Status Bar Chart